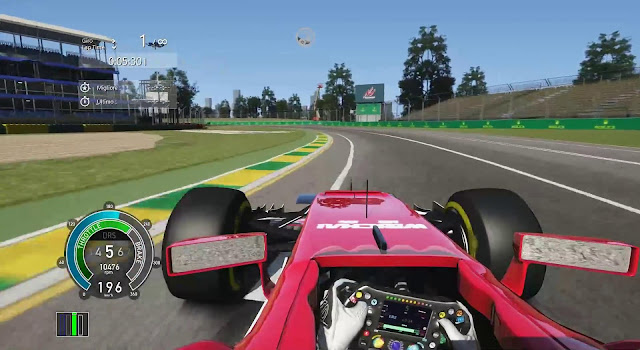
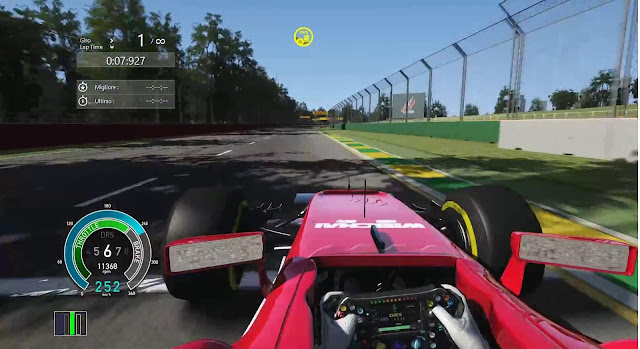
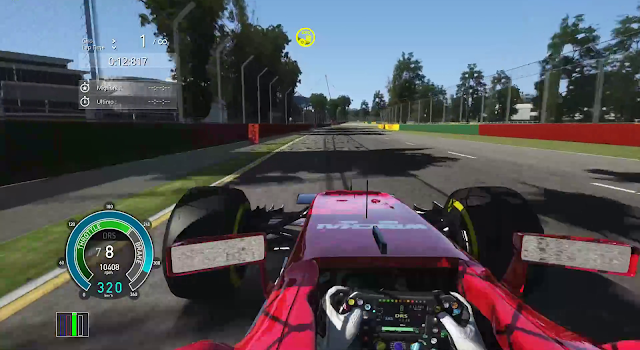
Due to the aforementioned, I've decided to do some video analysis and obtain timing information from very specific regions of the race track. Such regions were carefully chosen to reveal the strengths and weaknesses of the cars as well as possible mistakes, or outstanding performances, from the drivers.
Before getting into the timing data, a few notes must be taken:
- The comparison involves drivers' flying laps of which I had access to. So, if you don't find data for an specific car's/driver's lap, that is because a video of it was not available. Obviously, only laps which shows a car's full potential are considered for such comparison.
- Due to Intellectual Property Rights, I will not share any image, or footage, which legally belongs to the Formula One World Championship Limited ® or any other associated FORMULA ONE GROUP COMPANY. As such, aerial images and screenshots from a simulator will be used to denote the measured segments.
- The laps which comprises this comparison are : Hamilton's both Q3 laps, Vettel's final Q3 lap ( 1.22.456s ), Grosjean's Q3 lap ( 1.24.074s ) , Bottas' first Q3 lap ( 1.22.798s ) , Alonso's second Q2 lap ( 1.25.425s ) and Hulkenberg's fastest Free Practice 3 lap ( 1.25.063s ) which is on par with his fastest qualifying lap.
- Vettel's, Alonso's and Hamilton's laps, used during the video analysis, have 25/30 FPS ( frames per second ) , which yields less accuracy than the other videos, which have 50 FPS. Provided a flawless video ( no segment with any freezing whatsoever or etc ) , which is not always the case, the margin of error is almost certainly not greater than 1.3% on any measured segment as I have done, literally, dozens of similar video analysis and validated it's resulting data against telemetry data_ which were synchronised with the analysed videos' images and thus allowed me to calculate the average speeds of cars through an specific segment and deduce what should be the relative time gap between them, through that segment_ and have never found a discrepancy greater than the mentioned value ( usually, the margin of error is way bellow 1% ) .
- Telemetry data _such as speedometer and RPM information or throttle's/brake's input_ will be of limited use here because it was being displayed out of synchrony with the footage, on all videos. The gap between the images, and the telemetry informations displayed, would also vary throughout the laps, meaning the telemetry could be around 0.55s ahead of the footage at one moment and, on another point in the same video/lap, it could be only 0.44s ahead. As such, only basic speed information will be used in this comparison like : the maximum speed achieved by each car, on each relevant straigtht, and the minimum cornering speeds during the curves.
- Telemetry is not available on Alonso's and Bottas' videos.
1. First Measurement: From the start to just before the first braking
or
from here:

to here:

Driver/lap Max Speed(km/h) Time(s)
Hamilton's pole 1.22.188 327 2.48
Hamilton's first Q3 1.22.496 325 2.5
Bottas' first Q3 1.22.798 2.51
Vettel's best Q3 1.22.456 325 2.48
Grosjean's Q3 1.24.074 320 2.54
Alonso's best Q2 1.25.425 2.52
Hulkenberg's best FP3 1.25.063 318 2.56
Even before the first braking occurs, Hulkenberg already loses almost a tenth to Hamilton.
2. Second Measurement: The braking zone before the first corner
or
from the point shown on the last video game screenshot to here:

Driver/lap Time(s)
Hamilton's pole 1.22.188 1.24
Hamilton's first Q3 1.22.496 1.28
Bottas 1.31
Vettel 1.24
Grosjean 1.26
Alonso 1.33
Hulkenberg 1.3
As will become more evident with the remaining data, Mclaren's braking capability is subpar.
3. Third Measurement: The first corner (Jones Chicane)
or
from the point shown on the last video game screenshot to here:

Driver/lap Min Speed(km/h) Time(s)
Hamilton's pole 1.22.188 171 1.96
Hamilton's first Q3 1.22.496 165 2.04
Bottas 2.04
Vettel 170 1.92
Grosjean 161 2.04
Alonso 2.11
Hulkenberg 160 2.08
Also will become more evident, with the remaining data, that Mclaren's cornering capability is not great either, on most corners.
4. Fourth Measurement: The exit of the first corner
or
from the point shown on the last video game screenshot to here:

Driver/lap Time(s)
Hamilton's pole 1.22.188 2.56
Hamilton's first Q3 1.22.496 2.64
Bottas 2.58
Vettel 2.64
Grosjean 2.66
Alonso
Hulkenberg 2.62
There is a very small freezing on Alonso's video which means reliable data could not be gathered.
Vettel gained some hundredths on Hamilton's pole lap, during the first corner, but more than paid for that on the exit of it.
It's also clear how much Hamilton improved, from his first to his second Q3 lap, already on the first corner.
Overall, Grosjean is pretty on par with Hamilton's first Q3 lap through the whole Turn 1 segment ( braking, cornering and exit ) and this is just the first indication of how good this car is, on corners.
5. Fifth Measurement: The following straight
or
from the point shown on the last video game screenshot to here:

Driver/lap Max Speed(km/h) Time(s)
Hamilton's pole 1.22.188 315 4.56
Hamilton's first Q3 1.22.496 312 4.6
Bottas 4.58
Vettel 313 4.62
Grosjean 311 4.62
Alonso 4.68
Hulkenberg 306 4.64
As expected, Honda and Renault powered cars lag behind here.
6. Sixth Measurement: The braking zone before the first hairpin
or
from the point shown on the last video game screenshot to here:
Driver/lap Time(s)
Hamilton's pole 1.22.188 1.92
Hamilton's first Q3 1.22.496 1.96
Bottas 1.96
Vettel 1.98
Grosjean 2
Alonso 2.1
Hulkenberg 2.08
Again, as it will become clear that this is the norm, Mclaren was the worst car, braking wise.
During his pole lap, Hamilton considerably improved here and gained a good amount of time on everybody.
On the next page, the impressive performance from the Mercedes cars, throughout the first hairpin.


